
Population of the Republic of Azerbaijan
- ❯ Population number (as of the beginning of the year)
- ❯ Birth, death and natural increase
- ❯ Population by age groups (as of the beginning of the year)
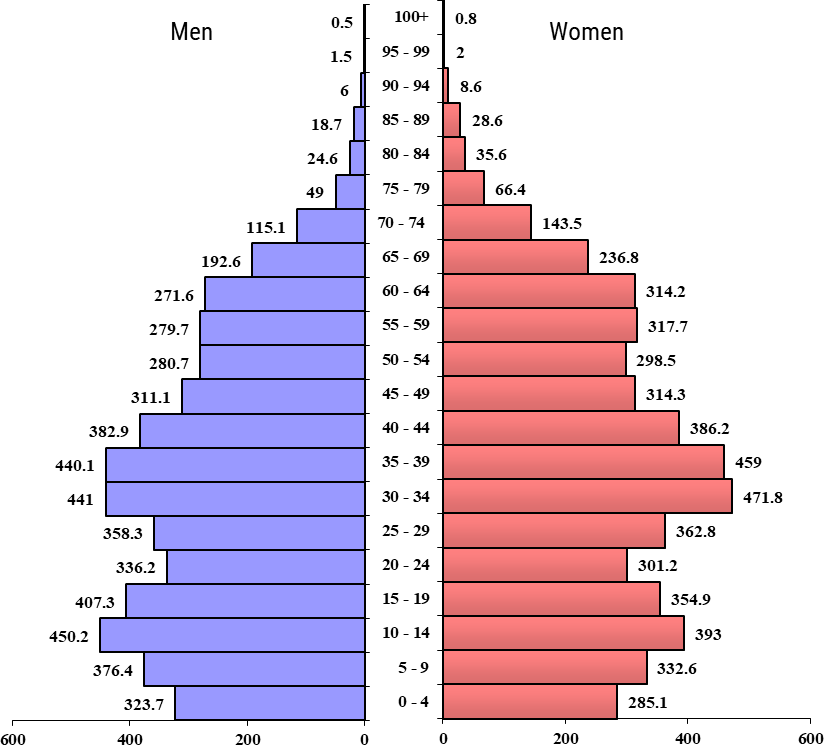
- ❯ Population of the Republic of Azerbaijan by sex and age groups as of the beginning of 2024 (in thousands)
- ❯ Marriages and divorces
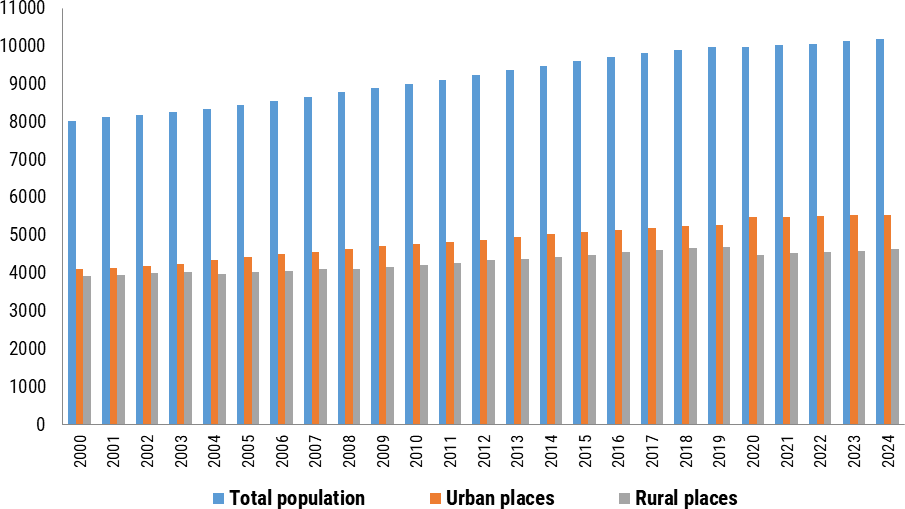
Number of population (as of the beginning of the year)
| Years | Total population, (in thousands) |
including: | as % to total population | ||
|---|---|---|---|---|---|
| urban places | rural places | urban places | rural places | ||
| 2000 | 8 032,8 | 4 107,3 | 3 925,5 | 51,1 | 48,9 |
| 2001 | 8 114,3 | 4 149,1 | 3 965,2 | 51,1 | 48,9 |
| 2002 | 8 191,4 | 4 192,6 | 3 998,8 | 51,2 | 48,8 |
| 2003 | 8 269,2 | 4 237,6 | 4 031,6 | 51,2 | 48,8 |
| 2004 | 8 349,1 | 4 358,4 | 3 990,7 | 52,2 | 47,8 |
| 2005 | 8 447,4 | 4 423,4 | 4 024,0 | 52,4 | 47,6 |
| 2006 | 8 553,1 | 4 502,4 | 4 050,7 | 52,6 | 47,4 |
| 2007 | 8 666,1 | 4 564,2 | 4 101,9 | 52,7 | 47,3 |
| 2008 | 8 779,9 | 4 652,2 | 4 127,7 | 53,0 | 47,0 |
| 2009 | 8 897,0 | 4 727,8 | 4 169,2 | 53,1 | 46,9 |
| 2010 | 8 997,6 | 4 774,9 | 4 222,7 | 53,1 | 46,9 |
| 2011 | 9 111,1 | 4 829,5 | 4 281,6 | 53,0 | 47,0 |
| 2012 | 9 235,1 | 4 888,7 | 4 346,4 | 52,9 | 47,1 |
| 2013 | 9 356,5 | 4 966,2 | 4 390,3 | 53,1 | 46,9 |
| 2014 | 9 477,1 | 5 045,4 | 4 431,7 | 53,2 | 46,8 |
| 2015 | 9 593,0 | 5 098,3 | 4 494,7 | 53,1 | 46,9 |
| 2016 | 9 705,6 | 5 152,4 | 4 553,2 | 53,1 | 46,9 |
| 2017 | 9 810,0 | 5 199,0 | 4 611,0 | 53,0 | 47,0 |
| 2018 | 9 898,1 | 5 237,8 | 4 660,3 | 52,9 | 47,1 |
| 2019 | 9 981,5 | 5 273,9 | 4 707,6 | 52,8 | 47,2 |
| 2020 | 9 974,0 | 5 476,8 | 4 497,2 | 54,9 | 45,1 |
| 2021 | 10 026,1 | 5 494,4 | 4 531,7 | 54,8 | 45,2 |
| 2022 | 10 063,3 | 5 502,5 | 4 560,8 | 54,7 | 45,3 |
| 2023 | 10 127,1 | 5 527,2 | 4 599,9 | 54,6 | 45,4 |
| 2024 | 10 180,8 | 5 547,8 | 4 633,0 | 54,5 | 45,5 |
Population Number (as of the beginning of the year, in thousands)
Population Number (as of the beginning of the year, in thousands)

Birth, death and natural increase
| Years | Person | Per 1000 population | ||||
|---|---|---|---|---|---|---|
| Births | Deaths | Natural increase | Births | Deaths | Natural increase | |
| 2000 | 116 994 | 46 701 | 70 293 | 14,7 | 5,9 | 8,8 |
| 2001 | 110 356 | 45 284 | 65 072 | 13,7 | 5,6 | 8,1 |
| 2002 | 110 715 | 46 522 | 64 193 | 13,7 | 5,7 | 8,0 |
| 2003 | 113 467 | 49 001 | 64 466 | 13,9 | 6,0 | 7,9 |
| 2004 | 131 609 | 49 568 | 82 041 | 15,9 | 6,0 | 9,9 |
| 2005 | 141 901 | 51 962 | 89 939 | 16,9 | 6,2 | 10,7 |
| 2006 | 148 946 | 52 248 | 96 698 | 17,5 | 6,2 | 11,3 |
| 2007 | 151 963 | 53 655 | 98 308 | 17,7 | 6,2 | 11,5 |
| 2008 | 152 086 | 52 710 | 99 376 | 17,4 | 6,0 | 11,4 |
| 2009 | 152 139 | 52 514 | 99 625 | 17,2 | 5,9 | 11,3 |
| 2010 | 165 643 | 53 580 | 112 063 | 18,5 | 6,0 | 12,5 |
| 2011 | 176 072 | 53 762 | 122 310 | 19,4 | 5,9 | 13,5 |
| 2012 | 174 469 | 55 017 | 119 452 | 19,0 | 6,0 | 13,0 |
| 2013 | 172 671 | 54 383 | 118 288 | 18,6 | 5,8 | 12,8 |
| 2014 | 170 503 | 55 648 | 114 855 | 18,1 | 5,9 | 12,2 |
| 2015 | 166 210 | 54 697 | 111 513 | 17,4 | 5,7 | 11,7 |
| 2016 | 159 464 | 56 648 | 102 816 | 16,5 | 5,9 | 10,6 |
| 2017 | 144 041 | 57 109 | 86 932 | 14,8 | 5,9 | 8,9 |
| 2018 | 138 982 | 57 250 | 81 732 | 14,2 | 5,8 | 8,4 |
| 2019 | 141 179 | 55 916 | 85 263 | 14,2 | 5,6 | 8,6 |
| 2020 | 126 571 | 75 647 | 50 924 | 12,7 | 7,6 | 5,1 |
| 2021 | 112 284 | 76 878 | 35 406 | 11,2 | 7,7 | 3,5 |
| 2022 | 122 846 | 60 810 | 62 036 | 12,2 | 6,0 | 6,2 |
| 2023 | 112 620 | 60 150 | 52 470 | 11,1 | 5,9 | 5,2 |
Population by age groups (as of the beginning of the year)
| Age groups | Thsd person | As % of total population | ||||||||||
|---|---|---|---|---|---|---|---|---|---|---|---|---|
| 2019 | 2020 | 2021 | 2022 | 2023 | 2024 | 2019 | 2020 | 2021 | 2022 | 2023 | 2024 | |
| Total population | 9981,5 | 9974,0 | 10026,1 | 10063,3 | 10127,1 | 10180,8 | 100,0 | 100,0 | 100,0 | 100,0 | 100,0 | 100,0 |
| including by age groups: | ||||||||||||
| 0-4 | 771,8 | 687,1 | 663,0 | 637,2 | 635,7 | 608,8 | 7,7 | 6,9 | 6,6 | 6,3 | 6,3 | 6,0 |
| 5-9 | 829,7 | 825,5 | 809,9 | 777,0 | 738,0 | 709,0 | 8,3 | 8,3 | 8,1 | 7,7 | 7,3 | 6,9 |
| 10-14 | 637,6 | 798,7 | 818,1 | 838,7 | 843,2 | 843,2 | 6,4 | 8,0 | 8,2 | 8,4 | 8,3 | 8,3 |
| 15-19 | 646,8 | 651,3 | 673,7 | 698,7 | 729,2 | 762,2 | 6,5 | 6,5 | 6,7 | 6,9 | 7,2 | 7,5 |
| 20-24 | 760,6 | 692,0 | 661,1 | 644,5 | 640,2 | 637,4 | 7,6 | 6,9 | 6,6 | 6,4 | 6,3 | 6,3 |
| 25-29 | 916,8 | 879,7 | 844,9 | 801,4 | 759,8 | 721,1 | 9,2 | 8,8 | 8,4 | 8,0 | 7,5 | 7,1 |
| 30-34 | 919,8 | 927,9 | 936,3 | 941,0 | 930,6 | 912,8 | 9,2 | 9,3 | 9,3 | 9,4 | 9,2 | 9,0 |
| 35-39 | 787,8 | 793,2 | 819,7 | 847,5 | 873,8 | 899,1 | 7,9 | 7,9 | 8,2 | 8,4 | 8,6 | 8,8 |
| 40-44 | 651,3 | 665,9 | 690,1 | 715,5 | 742,6 | 769,1 | 6,5 | 6,7 | 6,9 | 7,1 | 7,3 | 7,5 |
| 45-49 | 622,6 | 579,2 | 582,6 | 587,9 | 603,2 | 625,4 | 6,2 | 5,8 | 5,8 | 5,8 | 6,0 | 6,1 |
| 50-54 | 648,6 | 618,2 | 611,1 | 605,0 | 589,9 | 579,2 | 6,5 | 6,2 | 6,1 | 6,0 | 5,8 | 5,7 |
| 55-59 | 643,7 | 618,2 | 612,9 | 603,6 | 600,7 | 597,4 | 6,5 | 6,2 | 6,1 | 6,0 | 5,9 | 5,9 |
| 60-64 | 466,1 | 514,9 | 540,0 | 562,0 | 580,8 | 585,8 | 4,7 | 5,2 | 5,4 | 5,6 | 5,8 | 5,8 |
| 65-69 | 277,3 | 316,1 | 342,0 | 364,6 | 396,7 | 429,4 | 2,8 | 3,2 | 3,4 | 3,6 | 3,9 | 4,2 |
| 70 and over | 401,0 | 406,1 | 420,7 | 438,7 | 462,7 | 500,9 | 4,0 | 4,1 | 4,2 | 4,4 | 4,6 | 4,9 |
Population of the Republic of Azerbaijan by sex and age groups as of the beginning of 2024 (in thousands)
Marriages and divorces
| Years | Marriages | Divorces | Per 1000 population | |
|---|---|---|---|---|
| Marriages | Divorces | |||
| 2000 | 39 611 | 5 478 | 5,0 | 0,7 |
| 2001 | 41 861 | 5 382 | 5,2 | 0,7 |
| 2002 | 41 661 | 5 738 | 5,1 | 0,7 |
| 2003 | 56 091 | 6 671 | 6,8 | 0,8 |
| 2004 | 62 177 | 6 914 | 7,5 | 0,8 |
| 2005 | 71 643 | 8 895 | 8,5 | 1,1 |
| 2006 | 79 443 | 7 817 | 9,4 | 0,9 |
| 2007 | 81 758 | 8 340 | 9,5 | 1,0 |
| 2008 | 79 964 | 7 933 | 9,2 | 0,9 |
| 2009 | 78 072 | 7 784 | 8,8 | 0,9 |
| 2010 | 79 172 | 9 061 | 8,9 | 1,0 |
| 2011 | 88 145 | 10 747 | 9,7 | 1,2 |
| 2012 | 79 065 | 11 087 | 8,6 | 1,2 |
| 2013 | 86 852 | 11 730 | 9,3 | 1,3 |
| 2014 | 84 912 | 12 088 | 9,0 | 1,3 |
| 2015 | 68 773 | 12 764 | 7,2 | 1,3 |
| 2016 | 66 771 | 13 114 | 6,9 | 1,4 |
| 2017 | 62 923 | 14 514 | 6,5 | 1,5 |
| 2018 | 62 484 | 14 857 | 6,4 | 1,5 |
| 2019 | 63 869 | 17 148 | 6,4 | 1,7 |
| 2020 | 35 348 | 14 628 | 3,5 | 1,5 |
| 2021 | 56 314 | 17 191 | 5,6 | 1,7 |
| 2022 | 61 939 | 15 983 | 6,1 | 1,6 |
| 2023 | 54 200 | 21 688 | 5,3 | 2,1 |